Animating the Deglaciation of the Cordilleran Ice Sheet
The topography of the Pacific Northwest, its fjords, inland waterways and islands, are a result of an extended period of glaciation and glacial retreat. This retreat influenced the physical features and the resulting succession of vegetation that led to the landscape we see today. Despite this importance of the Cordilleran ice sheet and the large volume of research on the topic, there lacks a good detailed animation of the movement of the entire ice sheet from the last glacial maximum to the present day. In this study, I used spatial data of the glacial extent at different periods of time during the Quaternary period to model and animate the movement of the Cordilleran ice sheet as it retreated from 18,000 BCE to 10,000 BCE. Fluctuations in the shape and size of the ice sheet are quantified and show how it lost and gained material over time. The visualization also revealed the sequential development of geologic events important to the region such as the opening of the Salish Sea to the Pacific Ocean.
An interactive web application of this study can be viewed here.
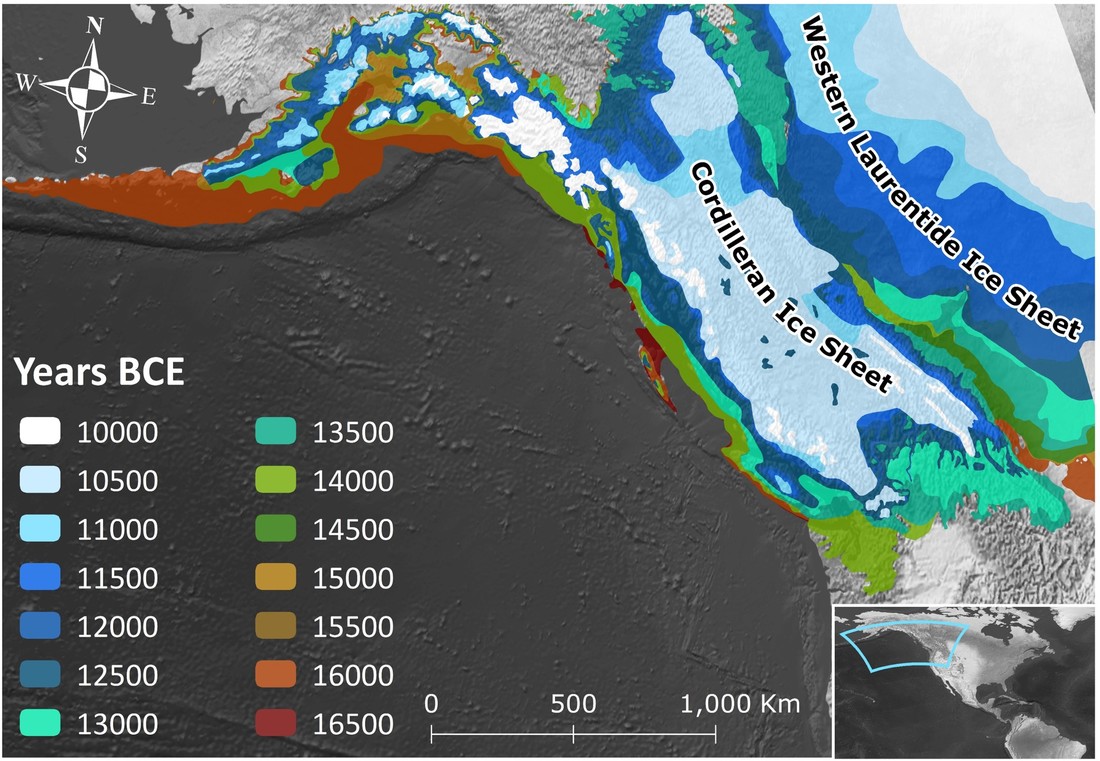
The majority of my analysis was performed using the glacial data provided publicly by J. Ehlers, P.L. Gibbard, and P.D. Hughes to complement their publication on worldwide quaternary glaciations (Ehlers et al., 2010). The information on periods of glacial extent went as far as 18,000 BCE. In order to create my visual representation, and gather unified areal statistics, I had to decide on a region of quadrangles to use for my analysis. Based on the image provided in the database as well as other visualizations of the extent of the Cordilleran. I selected a series of quadrangles with the goal to unify the different glacial covers into one coverage for the entire Cordilleran and parts of the western Laurentide. I used an iterator to export the input shapefiles into feature datasets within my geodatabase to maintain a level of organization based upon the combined quadrangles regions.
With these regions in place I designed a baseline model within ArcMap to project the quadrangles into a custom Contiguous Equidistant Conic projection and merge shapefiles for each lettered region from 18,000 BCE to 10,000 BCE for every 500 year increment. I then collected summary statistics to quantify my results:
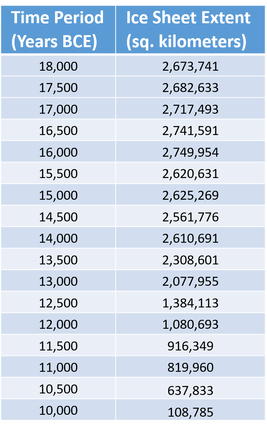
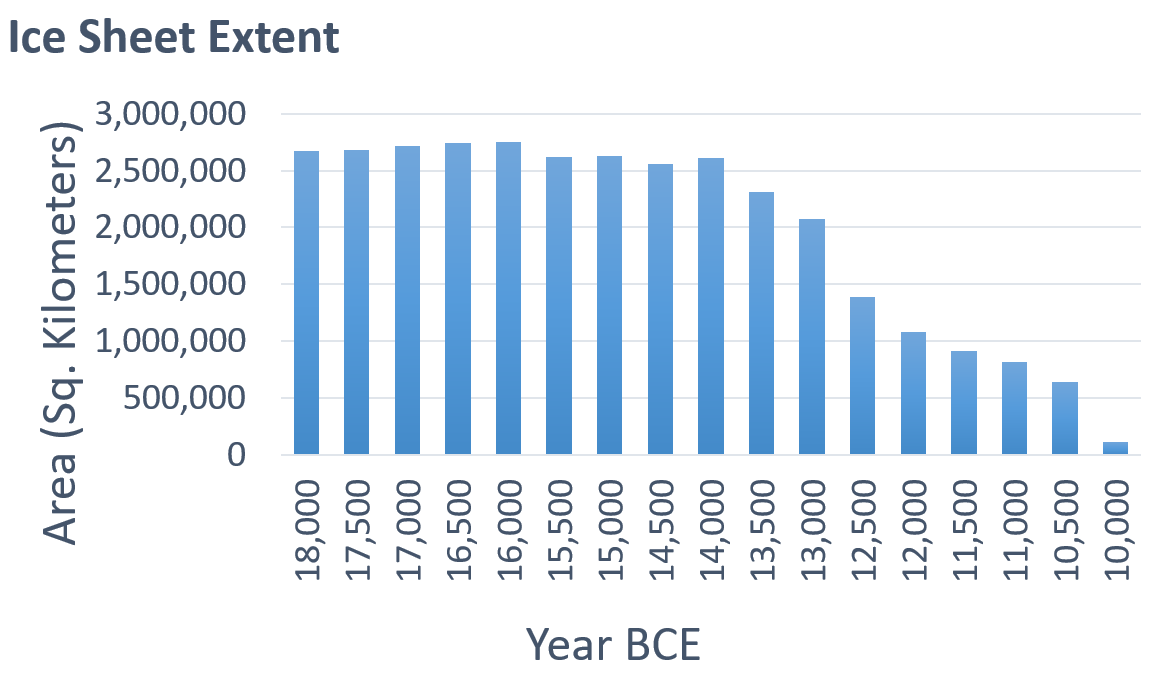
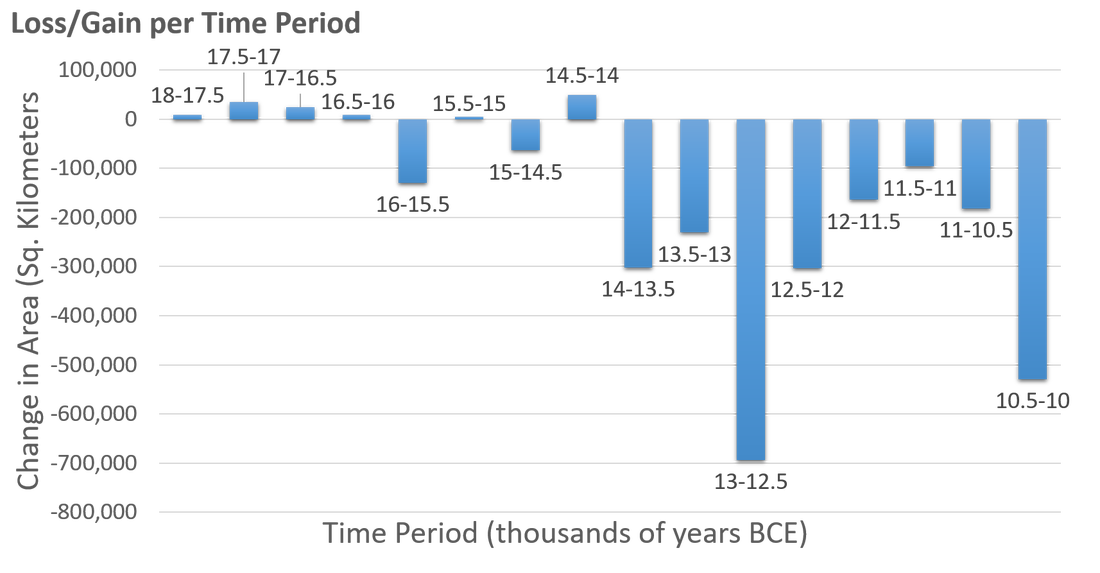
Collecting and putting together such a large database was a time consuming and difficult task, and I believe that public data on prehistoric climate or land cover should be more readily available. Additionally, since the glacial extents incorporate both the Laurentide and the Cordilleran the statistical analysis of the Cordilleran incorporated additional kilometers from portions of the Western Laurentide. The significance of my results however, help to show that what is commonly understood as the ‘ice age’ or last glacial maximum was not wholly stagnant. There were periods of change within its deglaciation phase where it grew, shrank and covered or uncovered different areas. These different rates of growth or decrease highlight important events in the region’s history and may have proven important to the migration of marine and terrestrial life into the Pacific Northwest. The resulting animation and time series images illustrate the importance of the Cordilleran ice sheet on the development of the region's physical identity. Future analyses could expand the topic into vegetational succession, or more minute periods of glaciation that came in the following millennia.